程序员必备工具之Jupyter
Python利器
程序员必备工具之Jupyter
IPython 和 Jupyter
IPython 是一个 Python REPl shell,环境远比 Python 自带的强大,而 Jupyter Notebook 则是一个基于 IPython REPl 的 Web 应用,运行结果可保存为后缀.ipynb,交互性强,所见即所得,数据分析,写分析报告等的不二利器。
官方解释:
The Jupyter Notebook is a web application that allows you to create and share documents that contain live code, equations, visualizations and explanatory text. Uses include: data cleaning and transformation, numerical simulation, statistical modeling, machine learning and much more.
安装
如果安装了 Anaconda,那么你已经有 Jupyter 了,打开终端,输入 jupyter notebook 即可。
远程使用
如果有远程使用的需求,则需把远程服务器配置下。
# 服务器下载 ssh 服务,如 Debian
sudo apt-get install openssh-server
# 不知道 ssh 是否打开,可以把他重启下
sudo service sshd restart
然后可以在局域网用其他电脑访问下,Mac 可直接在终端输入 ssh username@ip, 这里的 ip 指的局域网下的这台服务器的 ip,建议在路由器设置成静态 ip,若在外网使用,则需在路由器里面设置好端口转发。
然后参考官方教程 Running a notebook server 配置,有几个地方要注意下:
jupyter_notebook_config.py 这个文件里面 certfile 和 keyfile 的地址应为绝对地址,如我的是
jupyter notebook --certfile=/home/scott/.jupyter/mycert.pem --keyfile /home/scott/.jupyter/mykey.key
一大串输入很麻烦,也易出错,建议打开 .zshrc,并在底部添加一行:
alias jn='jupyter notebook --certfile=/home/scott/.jupyter/mycert.pem --keyfile /home/scott/.jupyter/mykey.key'
这样到其他电脑键入:
jn
若能看到类似下方的输出,证明配置成功了。
[I 09:56:29.937 NotebookApp] The Jupyter Notebook is running at: https://[all ip addresses on your system]:8889/
我的端口配置的是 8889, 你也可以设置成其他的,再到路由器里配置下端口转发,大功告成。如果有用 R,也可用类似的方法配置下 RStudio Server,超简单。
快捷操作
Jupyter Notebook 的快捷键是一大亮点,如果有看过我这篇文章 《让 CapsLock 键更实用》(昨天顺手把 karabiner 配置的 gist 更新了),并对 Mac 或 Win 做了配置,那么你熟悉几个 Jupyter 的快捷,用 Jupyter 写报告之类基本上不需要鼠标了。
单元类型 (cell type)
Jupyter Notebook文档由一系列的单元 (cell) 组成,主要用的两类单元是:
markdown cell,命令模式下,按m可将单元切换为markdown cell。code cell,命令模式下,按y可将单元切换为code cell。
常用快捷
- 查看快捷键帮助:
h - 保存:
s - cell 间移动:
j,k - 添加 cell:
a,b - 删除 cell:
dd - cell 编辑:
x,c,v,z - 中断 kernel:
ii - 重启 kernel:
00 - 注释 code:
Ctrl + /
拆分单元 (split cell)
编辑模式下按 control + shift + - 可拆分 c ell
查看对象信息
import numpy as np
按 tab 键查看提示信息
np.<tab>
查找 numpy 模块下,名称含有 cos 的对象
np.*cos*?
提供 numpy 模块的帮助信息
np?
提供 numpy 模块更详细的帮助信息
np??
查看 docstring
%pdoc np
魔术命令
最常用的是这个 %matplotlib inline,有点类似 ipython --pylab,画图用的;测试程序运行时间则只需把 %time 放在前面。
更多魔术命令可在 Jupyter Notebook 里键入:
%lsmagic
转换
# ipynb 文件转为 html
jupyter nbconvert --to html filename.ipynb
更多转换内容,请键入:
jupyter notebook --help
转换 rst、py、md 等格式都是非常方便的,但转 pdf,对中文的支持不好。必须先装 LaTex,LaTex 则需先把字体等调好。
embed video
from IPython.display import YouTubeVideo
YouTubeVideo('wxVx54ax47s') # Yes, it can also embed youtube videos.
Data Science Libraries
Pandas
go through most of the documentation as a first step,Here are a few quick tricks to whet your appetite:
import pandas as pd

df = pd.DataFrame({ 'A' : 1.,
                    'B' : pd.Timestamp('20130102'),
                    'C' : pd.Series(1, index=list(range(4)), dtype='float32'),
                    'D' : pd.Series([1, 2, 1, 2], dtype='int32'),
                    'E' : pd.Categorical(["test", "train", "test", "train"]),
                    'F' : 'foo' })
df
| |A |B |C |D |E |F |0 |1 |2013-01-02 |1 |1 |test |foo |1 |1 |2013-01-02 |1 |2 |train |foo |2 |1 |2013-01-02 |1 |1 |test |foo |3 |1 |2013-01-02 |1 |2 |train |foo
df.B
|0 |2013-01-02 |1 |2013-01-02 |2 |2013-01-02 |3 |2013-01-02
Name: B, dtype: datetime64[ns]
Compute the sum of D for each category in E:
df.groupby('E').sum().D
E
|test |2 |train |4
Name: D, dtype: int32
Seaborn
While pandas comes prepackaged with anaconda, seaborn is not directly included but can easily be installed with conda install seaborn. Seaborn essentially treats Matplotlib as a core library (just like Pandas does with NumPy)
%matplotlib inline

import seaborn as sns

# Load one of the test data sets that come with seaborn
tips = sns.load_dataset("tips")

# statistical plot including the best fitting linear regression line
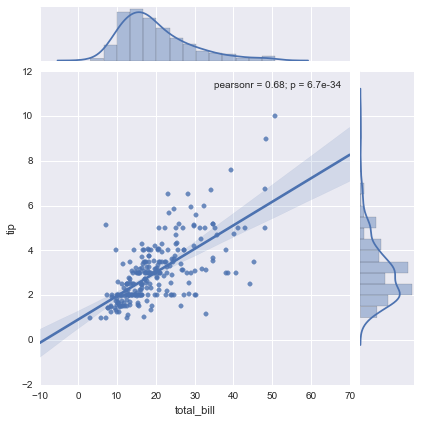
sns.jointplot("total_bill", "tip", tips, kind='reg');

tips.head()
| |total_bill |tip |sex |smoker |day time |size |0 |16.99 |1.01 |Female |No |Sun Dinner |2 |1 |10.34 |1.66 |Male |No |Sun Dinner |3 |2 |21.01 |3.50 |Male |No |Sun Dinner |3 |3 |23.68 |3.31 |Male |No |Sun Dinner |2 |4 |24.59 |3.61 |Female |No |Sun Dinner |4
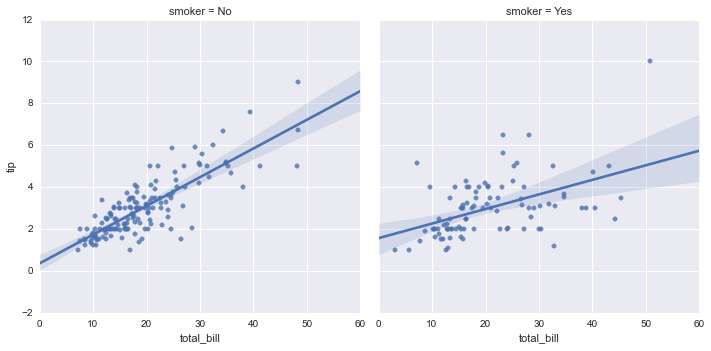
We might ask if smokers tip differently than non-smokers. Without seaborn, this would require a pandas groupby together with the complex code for plotting a linear regression. With seaborn, we can provide the column name we wish to split by as a keyword argument to col:
sns.lmplot("total_bill", "tip", tips, col="smoker");
